Interactive Graph
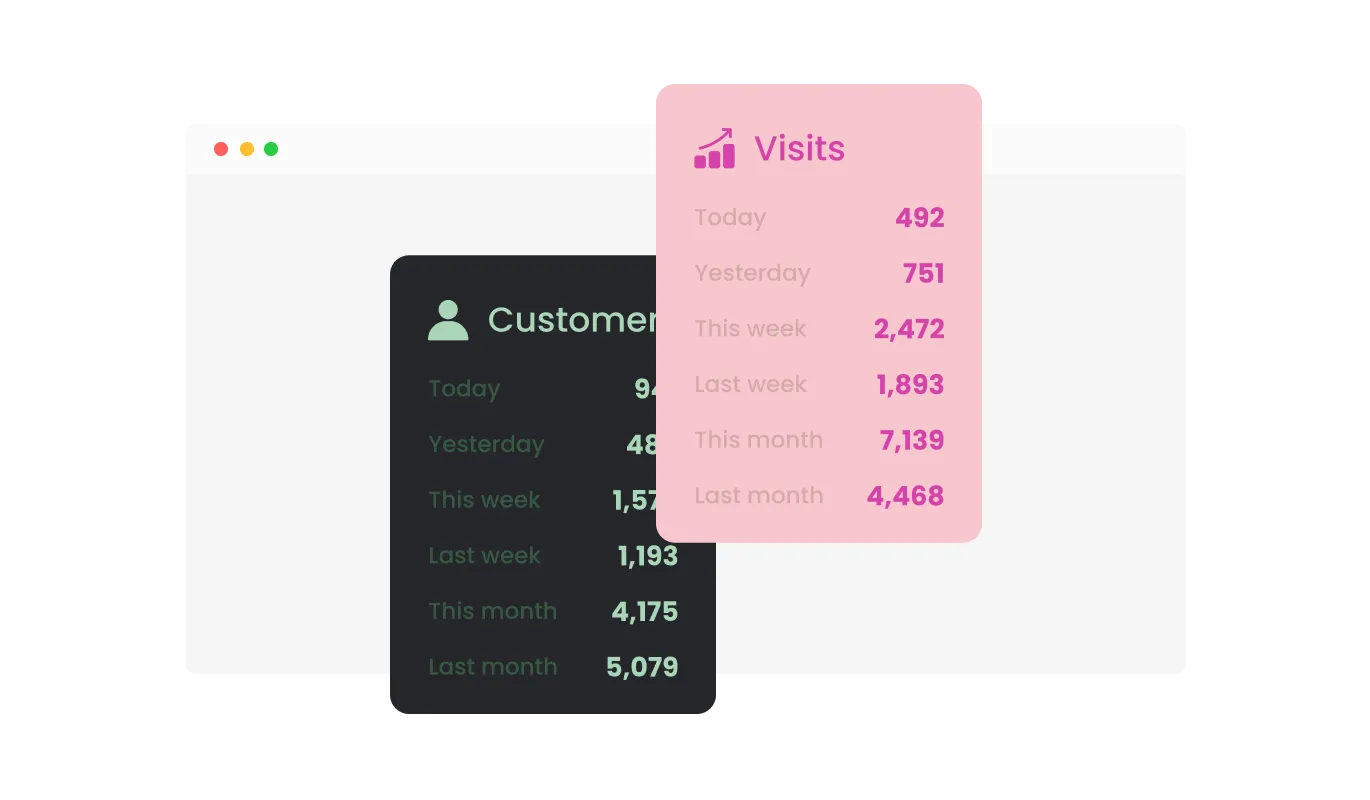
Visualize your visitor data with an interactive graph provided by the Visitor Counter plugin for Webflow. This feature allows you to see trends and patterns in your site traffic at a glance, making it easier to understand visitor behavior and track your Webflow website's performance over time. The interactive graph provides a clear and intuitive way to analyze your data.


